
Instructions
How to Create a Gantt Chart in Excel
May
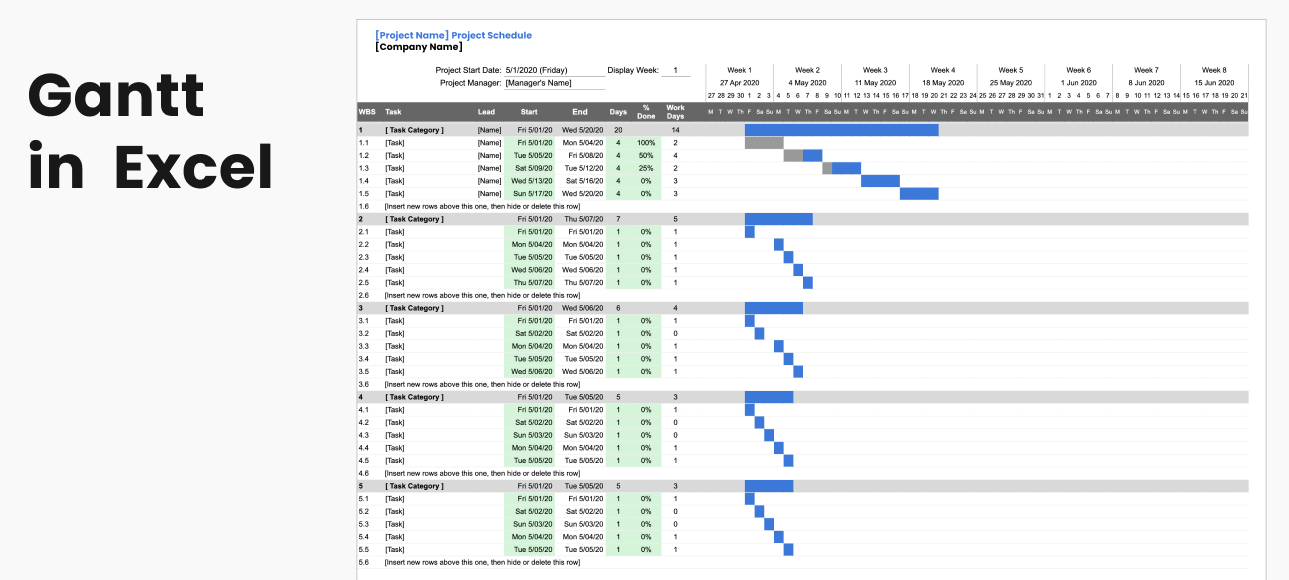
A Gantt chart is a simple way to show project tasks across a timeline. Microsoft says a Gantt chart helps you schedule project tasks and track progress, but it also notes that Excel does not have a predefined Gantt chart type. Instead, Microsoft says you can simulate one by customizing a stacked bar chart or use one of Excel’s free Gantt chart templates.
That means there are two practical ways to create a Gantt chart in Excel. You can build one manually with chart tools, or you can start with a template if you want something faster. Microsoft supports both approaches on its Excel pages.
Method 1: Create a Gantt Chart with a Stacked Bar Chart
This is the main manual method Microsoft describes.
Microsoft says to create a Gantt chart like its example by starting with task data that includes at least:
- task name
- start date
- duration
Step 1: Set up your data
A simple table usually looks like this:
- Task
- Start Date
- Duration
Microsoft’s Gantt chart page uses this kind of data setup before creating the chart.
Step 2: Select the data
Microsoft says to select the data you want to chart. In its example, that means selecting the task table before inserting the chart.
This works best when your worksheet is clean and each column has a clear header.
Step 3: Insert a stacked bar chart
Because Excel does not have a native Gantt chart type, the chart starts as a stacked bar chart.
Microsoft says to simulate a Gantt chart by customizing a stacked bar chart to show the start and finish timing of tasks.
The basic idea is:
- one series represents the start date
- the other series represents the duration
Step 4: Make the chart look like a Gantt chart
This is the important formatting step.
Microsoft says the Gantt look comes from customizing the stacked bar chart rather than using a separate chart type. The goal is to make the start-date portion act like hidden spacing and leave the duration bars visible across the timeline.
In practice, that means:
- keep the duration bars visible
- make the start date series visually disappear
- keep the task names on the chart
- use the date axis as the timeline
This is what turns a normal stacked bar chart into a Gantt-style project schedule. That setup is an inference from Microsoft’s chart description and example rather than a single quoted sentence.
Step 5: Adjust the timeline and labels
Microsoft’s template page says you should verify the time scale matches your needs and modify it if necessary. It also says you can add task names, start dates, duration, and status so the bars reflect your project plan clearly.
This is useful when you want to show:
- days
- weeks
- months
- project progress over time
Method 2: Use a Gantt Chart Template in Excel
This is the easiest option if you do not want to build the chart from scratch.
Microsoft offers free Gantt chart templates for Excel, including simple Gantt chart layouts and project planner versions. Its template page says you can start with a template, verify the timescale, add task names, dates, duration, and status, and let the stacked bars reflect the data automatically.
When a template is the better choice
Templates are useful if:
- you want a faster setup
- you do not want to format the chart manually
- you want a project planner layout right away
- you may reuse the same format often
What a Basic Gantt Chart in Excel Should Include
A useful Gantt chart usually includes:
- task names
- start dates
- durations
- a date-based timeline
- visible bars for task length
Microsoft’s support and template pages consistently center the chart around start dates, duration, and the time scale.
Why Excel Uses a Stacked Bar Chart for Gantt Charts
This is the part many users find confusing.
Microsoft says Excel does not have a predefined Gantt chart type, which is why the standard manual method is to simulate one with a stacked bar chart.
That is why a Gantt chart in Excel is really a customized bar chart rather than a special chart category.
FAQ
Does Excel have a built-in Gantt chart?
No. Microsoft says Excel does not have a predefined Gantt chart type.
How do I make a Gantt chart in Excel manually?
Microsoft says you can simulate one by customizing a stacked bar chart to show task start dates and duration.
Can I use a template for a Gantt chart in Excel?
Yes. Microsoft provides free Excel Gantt chart templates and says you can customize them with task names, dates, duration, and status.
What data do I need for a Gantt chart in Excel?
Microsoft’s support and template pages show that a basic Gantt chart should use task names, start dates, and duration.
Plan projects more efficiently with genuine Office keys, instant delivery, and easy activation that gets Excel ready without delays.